Which portion of temperature-time graph showing heating of ice at -10°C to water at 100°C represent the change of state on heating.
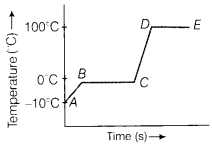
BC represents the change of state of ice from solid to liquid and DE represents the change of state of water from liquid to steam (gas).