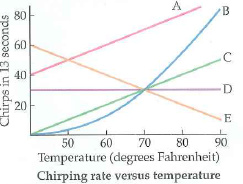
Which plot in Figure represents the chirping rate of the snowy tree cricket?
A B C D E
All chemical reactions, whether organic or inorganic, proceed at a rate that depends on temperature—the higher the temperature, the higher the rate of reaction. This can be understood in terms of molecules moving with increased energy as the temperature is increased, and colliding with other molecules more frequently. In the case of organic reactions, the result is that metabolic processes speed up with increasing temperature.
An increased or decreased metabolic rule can manifest itself in a number of ways. For example, a cricket trying to attract a mate chirps at a rate that depends on its overall rate of metabolism. As a result, the chirping rate of crickets depends directly on temperature, in fact, some people even use a pet cricket as a thermometer.
The cricket that is most accurate as a thermometer is the snowy tree cricket (Oeamthus fultoni Walker). Its rate of chirping is described by the following formula:
N = number of chirps per 13.0 seconds = T −40.0
In this expression, T is the temperature in degrees Fahrenheit.
Answer:
The snowy three Cricket has been found to chirp according to the following formula
![]()
Here, N is number of chirps per 13.0 seconds and T is temperature in degrees Fahrenheit.
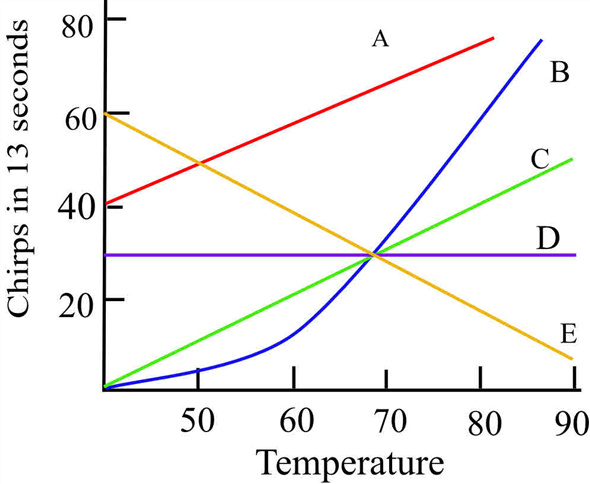
The following figure shows chirping rate versus temperature.
The initial point of x - axis starts at 40
The number of chirps per 13 seconds at T = 40 degree Fahrenheit is given by
![]()
The number of chirps per 13 seconds at T = 50 degree Fahrenheit is given by
![]()
The number of chirps per 13 seconds at T = 60 degree Fahrenheit is given by
![]()
The number of chirps per 13 seconds at T = 70 degree Fahrenheit is given by
![]()
The number of chirps per 13 seconds at T = 80 degree Fahrenheit is given by
![]()
The number of chirps per 13 seconds at T = 90 degree Fahrenheit is given by
![]()
From the figure plot A starts at 40, plot E starts at 60 and plot D starts at 30 so the chirping rate is not coincide with zero because at 40 degree Fahrenheit the line should be start at zero chirping rate.
Plot C and plot B starts from zero, so they follow chipping rate. From the above calculation chipping rate is linearly proportional to the temperature. Plot B is not a linear plot, so the plot represents chirping rate of snowy tree cricket.