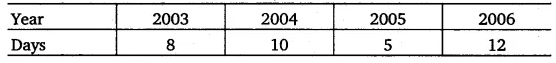
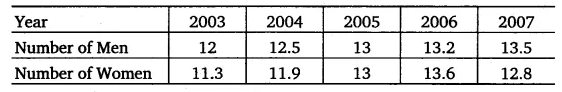
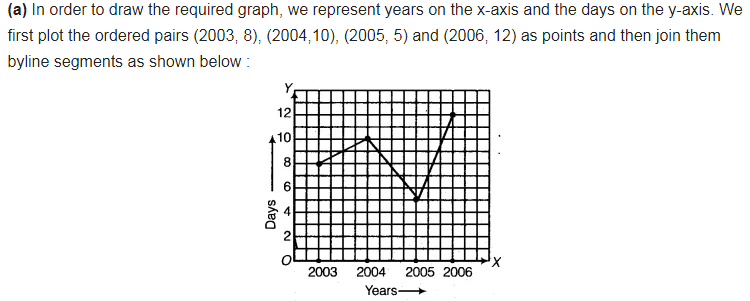
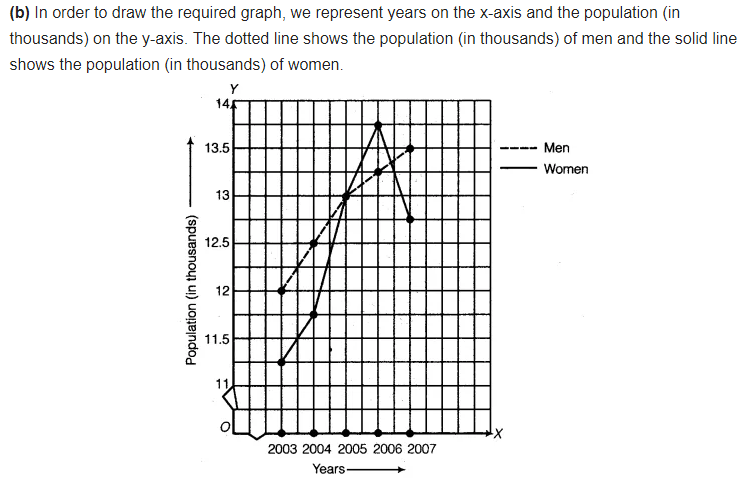
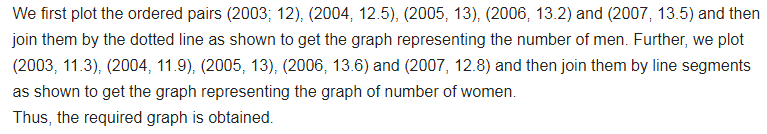
Use the tables below to draw linear graphs. (a) The number of days a bill side city received snow in different years (b) Population (in thousands) of men and women in a village in different years.