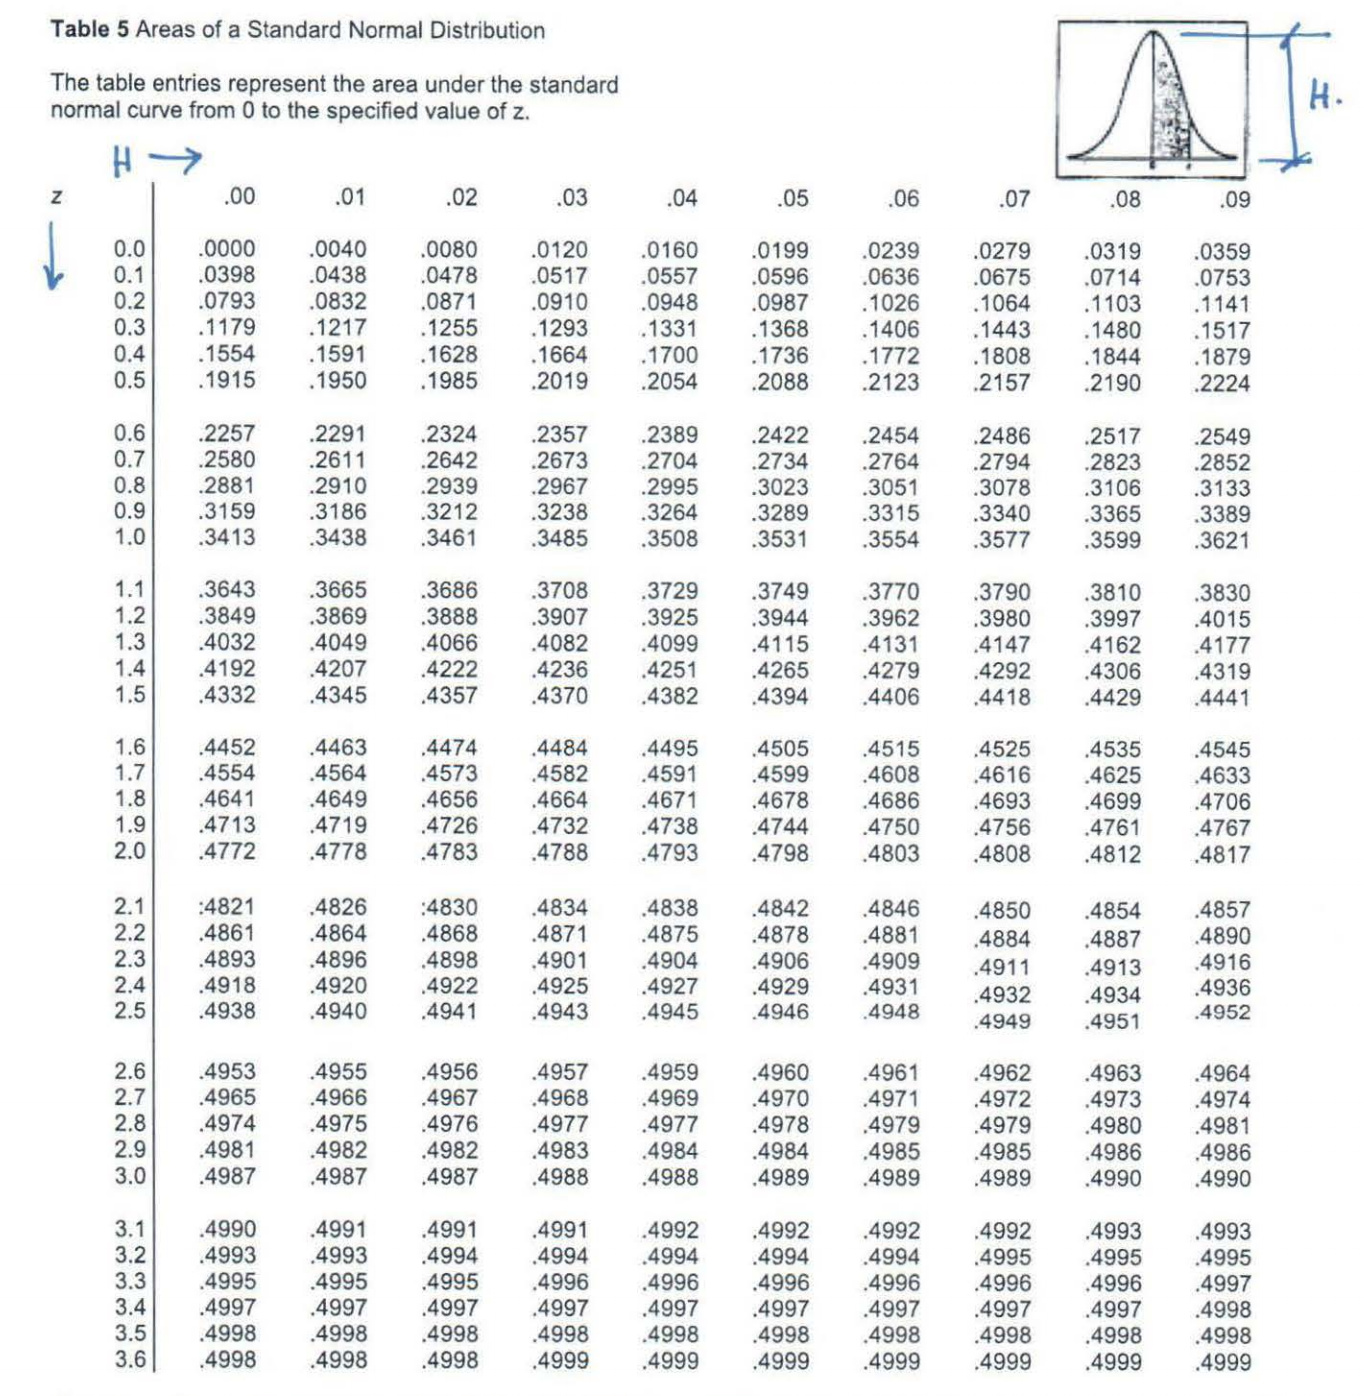
Use the following Normal Distribution table to calculate the area under the Normal Curve (Shaded area in the Figure) when Z=1.3 & H=0.05; Assume that you do not have vales of the area beyond z=1.2 in the table; i.e. you may need to use the extrapolation. Check your calculated value and compare with the values in the table [for z=1.3 & H=0.05]. Calculate your percentage of error in the estimation.
How do I solve this problem using extrapolation?
Answer:
Extrapolation:
Use the following Normal Distribution table to calculate the area under the Normal Curve (Shaded area in the Figure) when Z=1.3& H=0.05; Assume that you do not have vales of the area beyond z=1.2 in the table; i.e. you may need to use the extrapolation. Check your calculated value and compare with the values in the table [for z=1.3 & H=0.05]. Calculate your percentage of error in the estimation.
How do I solve this problem using extrapolation?
Solution:
Here, we have to use the technique of extrapolation for finding the probability for the z = 1.35 (Z=1.3& H = 0.05). Let us see this discuss this question step by step given as below:
For using extrapolation we need the values for the row of z = 1.2
The values for the row z and columns H are given as below:
By using the extrapolation, we get
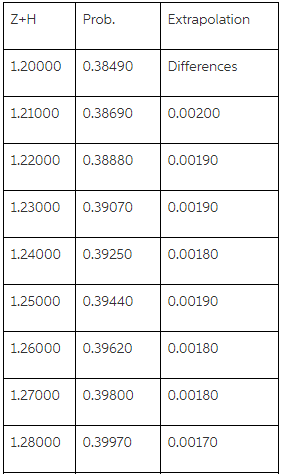
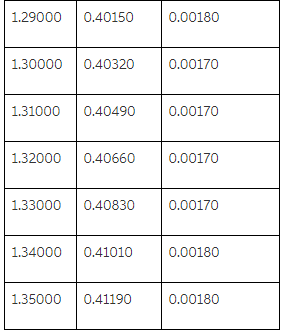
We get P(Z<1.35) = 0.4119 by using the extrapolation however the probability by using the table is given as 0.4115. This means there is a very small difference observed due extrapolation.