The velocity-time graph for a vehicle is shown. Draw the acceleration time graph from it.
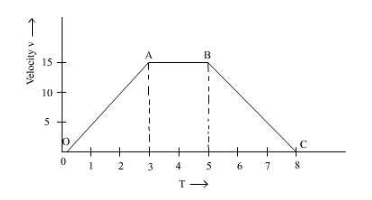
In time 1 to 3 s, acceleration of the vehicle is:
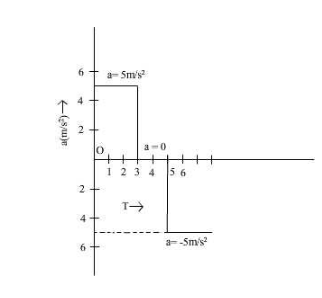
a = slope of OA = 5 m/s2
In time 3 to 5 sec velocity of the particle remains same, hence acceleration = zero.
In time 3 to 5, acceleration of the vehicle is:
a = slope of BC = 5 m/s2