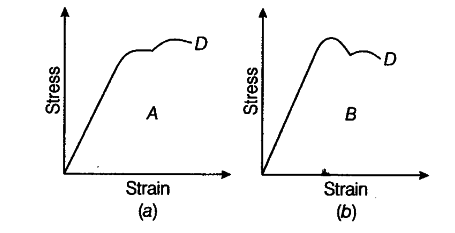
The stress-strain graphs for materials A and B are shown in Fig. (a) and Fig. (b).

The graphs are drawn to the same scale.
(i) Which of the materials has greater Young’s modulus?
(ii) Which of the two is the stronger material?
The stress-strain graphs for materials A and B are shown in Fig. (a) and Fig. (b).

The graphs are drawn to the same scale.
(i) Which of the materials has greater Young’s modulus?
(ii) Which of the two is the stronger material?
(i) In the two graphs, the slope of graph in Fig. (a) is greater than the slope of graph in Fig. (b), so material A has greater Youngs modulus.
(ii) Material A is stronger than material B because it can withstand more load without breaking. For material A, the break even point (D) is higher.