The speed-time graph for a car is shown in figure below.
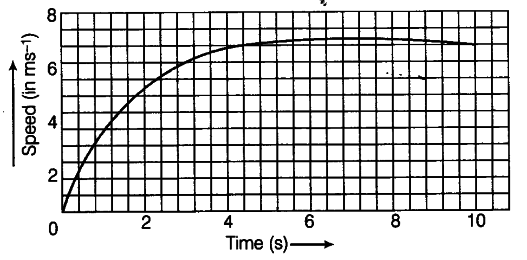
(i) Find how far the car travels in the first 4 s. Shade the area on the graph that represents the distance travelled by the car during the period.
(ii) Which part of the graph represent uniform motion of the car?
(i) The shaded portion of the car represents the distance travelled by the car in the first four seconds.
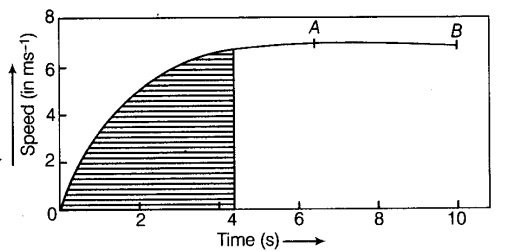
The car travels with a non-uniform speed which is accelerated in nature.
(ii) The straight line portion of the graph represents the uniform motion of the car i.e. from point A to B.