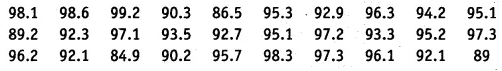
The relative humidity (in %) of a certain city for a month of 30 days was as follows
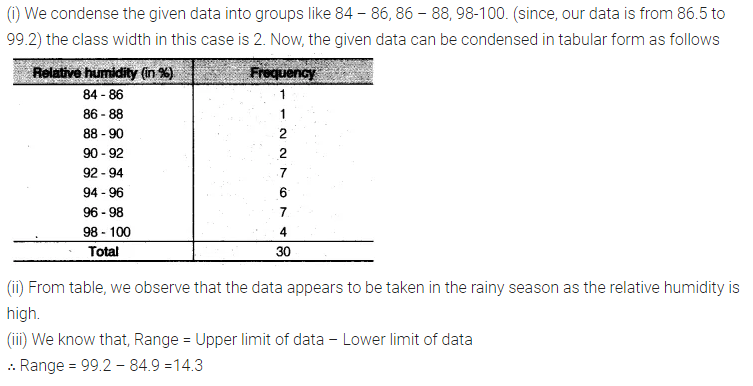
(i) Construct a grouped frequency distribution table with classes 84-86, 86-88 etc.
(ii) Which month or season do you think this data is about?
(iii) What is the range of this data?