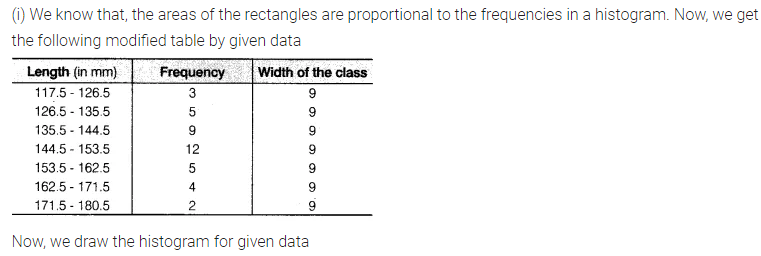
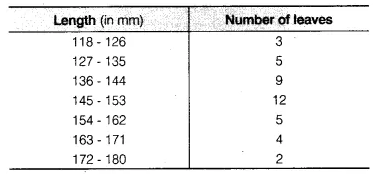
The length of 40 leaves of a plant measured correct to one millimetre and the obtained data is represented in the following table
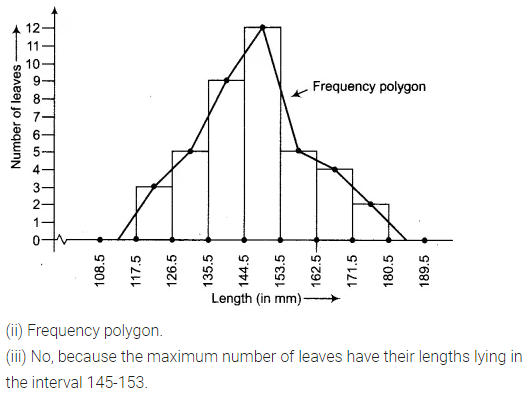
(i) Draw a histogram to represent the given data.
(ii) Is there any other suitable graphical representation for the same data?
(iii) Is it correct to conclude that the maximum number of leaves 153 mm long and Why?