The heights of 50 students, measured to the nearest centimeters have been found to be as follows
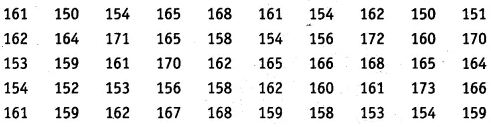
(i) Represent the data given above by a grouped frequency distribution table, taking class intervals as 160-165, 165-170 etc.
(ii) What can you conclude about their heights form the table?
