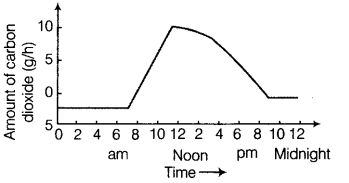
The graph shows how the amount of carbon dioxide taken in by a plant varies through a 24 hour period.
(i) At what time did photosynthesis started?
(ii) At what time was the photosynthesis greatest?
(iii) At what time of the day did it get dark?
(a) How does plant obtain CO_{2}?
(b) What happens to this CO_{2}?
(iv) What other factors could affect the rate of photosynthesis?
(i) Photosynthesis started at 7.00 am
(ii) The rate of photosynthesis was greatest at 12 noon as the amount of carbon dioxide taken in was greatest at that time.
(iii) At 9.00 pm, it was dark.
(iv) (a) Through stomata
(b) It is reduced to carbohydrates.
(v) Factors which affect the rate of photosynthesis are light, humidity, temperature and concentration levels of carbon dioxide in the air. There are optimum levels for each factor above which photosynthesis will start to decrease.