The graph between total path length and time for a particle moving along a straight line as shown in figure is not possible. Explain why?
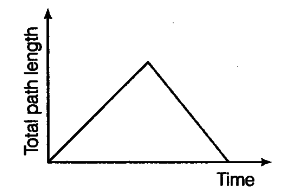
The graph shows that with the passage of time, total path length first increases and then decreases.
The path length always increases or remains constant with passage of time and it does not decrease with time as shown in figure.
Thus, this graph is not possible.