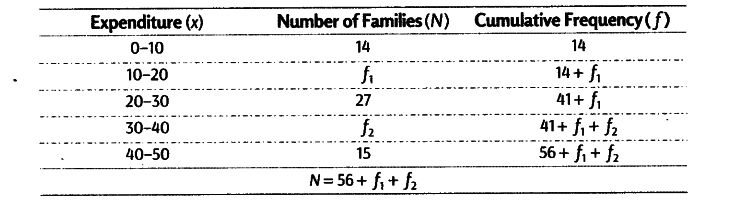
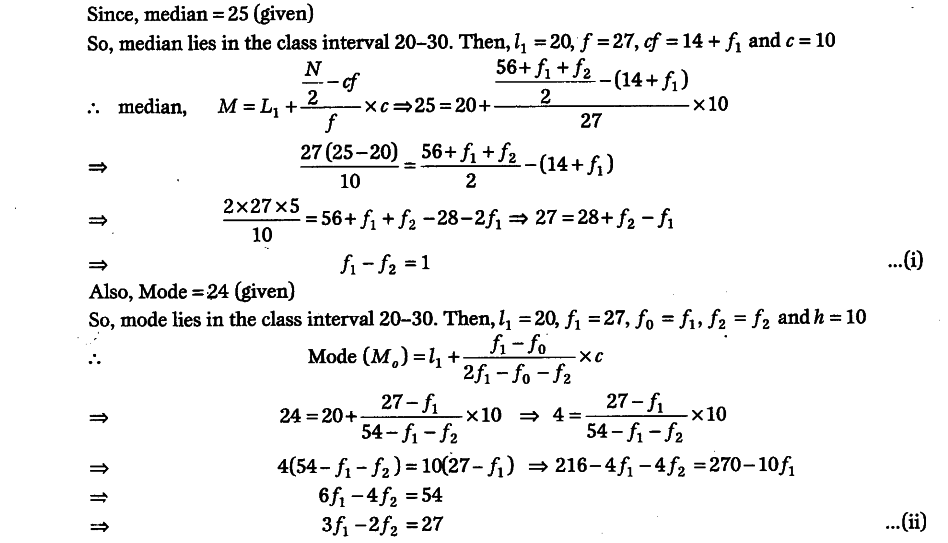
The following table shows the distribution of 105 families according to their expenditure per week. Number of families corresponding to the expenditure groups Rs.10-20 and Rs. 30-40 are missing from the table. The median and mode for the distribution are Rs.25 and 24, respectively.