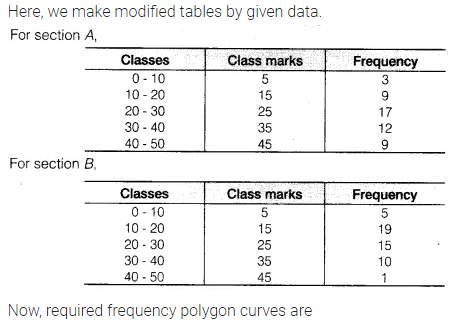
The following table gives the distribution of students of two sections according to the marks obtained by them
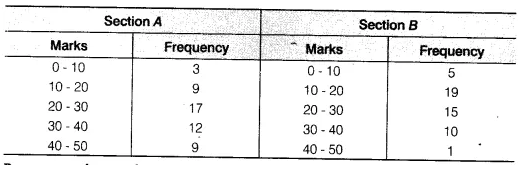
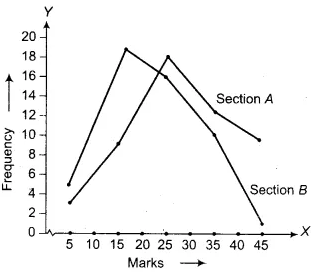
Represent the marks of the students of both the sections on the same graph by two frequency polygons. From the two polygons compare the performance of the two sections.