The following table gives production yield per hectare of wheat of 100 farms of a village.
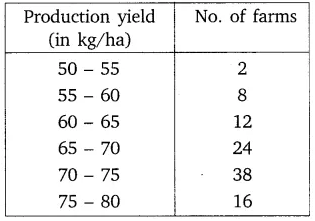
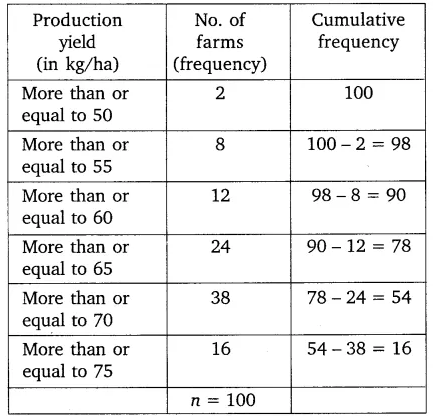
Change the distribution to a more than type distribution, and draw its ogive.
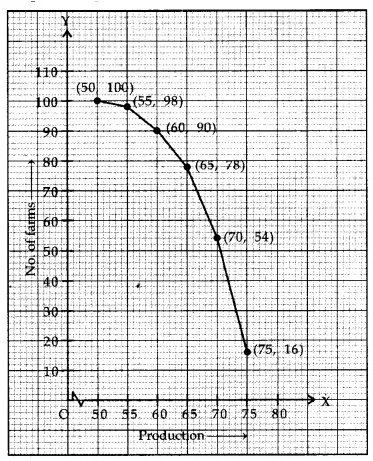
Now, we plot the points (50, 100), (55, 98), (60, 90), (65, 78), (70, 54) and (75, 16) to get the required ogive as shown below.