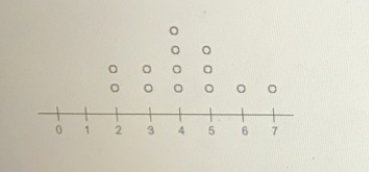
The dot plot represents the scores of a group of students on an English test if the dot plot is converted to a box plot the first quartile would be drawn at (2, 3, 4, 5) and the median would be drawn at (2, 3, 4, 5)
The dot plot represents the scores of a group of students on an English test if the dot plot is converted to a box plot the first quartile would be drawn at (2, 3, 4, 5) and the median would be drawn at (2, 3, 4, 5)