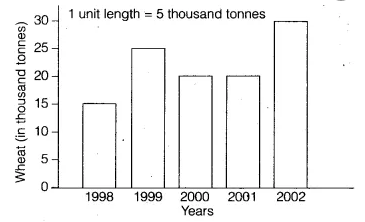
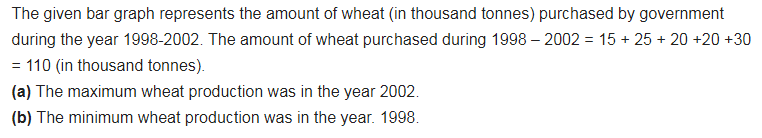
he bar graph given alongside shows the amount of wheat purchased by government during the year 1998-2002.
Read the bar graph and write down your observations. In which year was.
(a) the wheat production maximum?
(b) the wheat production minimum?