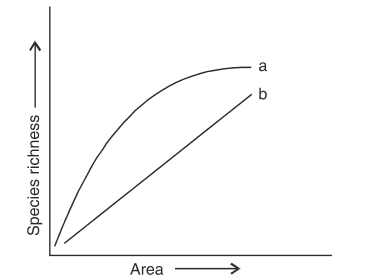
The above graph shows Species-Area relationship.Write the equation of the curve’a’ and explain.
The above graph shows Species-Area relationship.Write the equation of the curve’a’ and explain.
S=C${{A}^{z}}$
(i) Within a region, species richness increases with increasing explored area but only up to a limit.
(ii)Relationship between species richness and area for a wide variety of taxa turns out to be rectangular hyperbola.