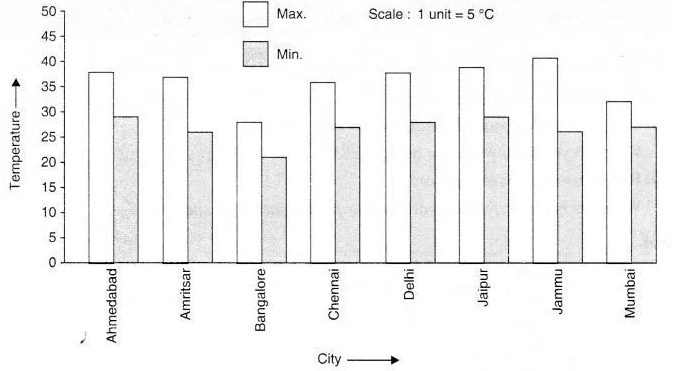
Take the data giving the minimum and the maximum temperature of various cities given in the beginning of this chapter. Plot a double bar graph using the data and answer the following:
- Which city has the largest difference in the minimum and maximum temperature on the given date? .
- Which is the hottest city and which is the coldest city?
- Name two cities where maximum temperature of one was less than the minimum temperature of the other.
- Name the city which has the least difference between its minimum and the maximum temperature.