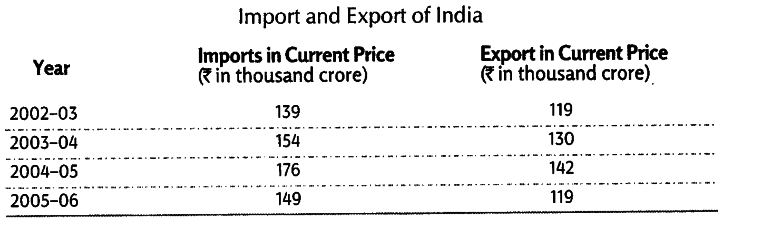
Represent the following data by an appropriate bar diagram
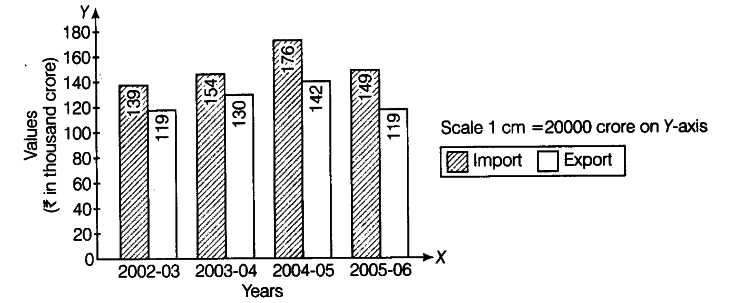
The bar diagram showing import and export of India is given below