The following table gives absolute values {in lakhs of tonnes) of food grains production in India.
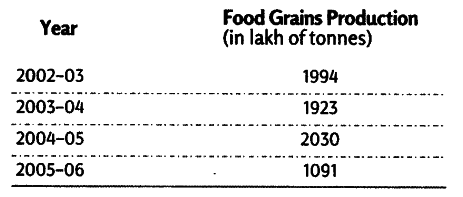
Represent the data by an appropriate bar diagram.
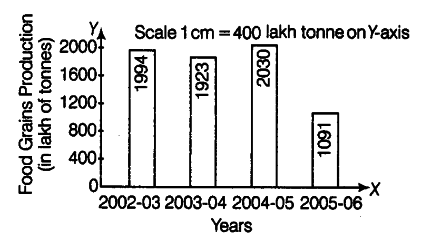
The bar diagram of given data is shown below
The following table gives absolute values {in lakhs of tonnes) of food grains production in India.
Represent the data by an appropriate bar diagram.
The bar diagram of given data is shown below