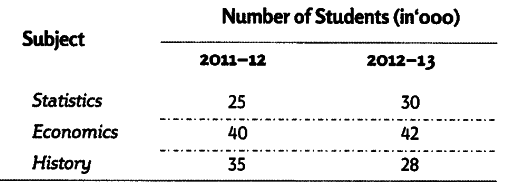
Present the following data by a percentage sub-divided bar diagram
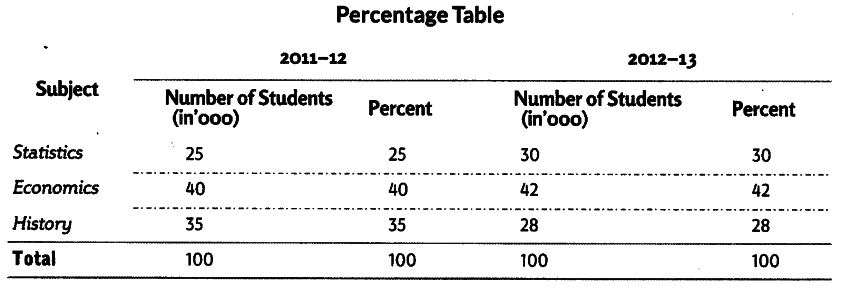
First, we prepare a percentage table.
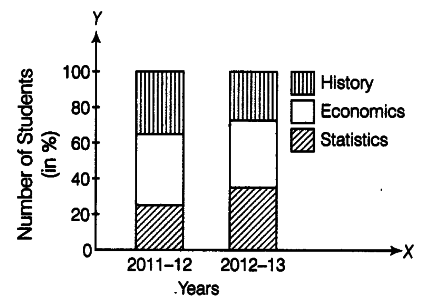
Now, we draw bars of equal length (100%) corresponding to each year. Then, each bar is divided according to percentage of different years.
A percentage sub-divided bar diagram of given data is shown below