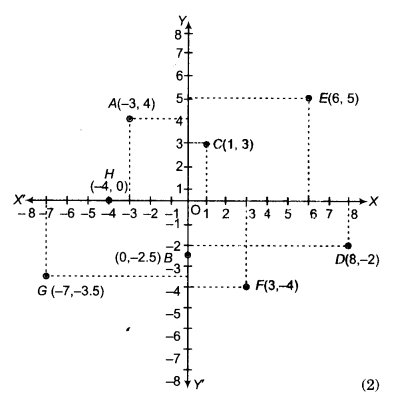
Plot the points (x, y) given in the following table on the plane choosing suitable units of distances on the axes.
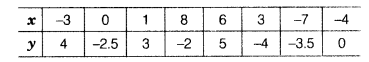
The given points are A(-3,4),S(0,-2 5),C(1,3), D(8,-2), E(6,5), F(3,-4), G(-7,-3.5)and H(-4,0).
Now, we plot the points on the graph paper as shown by dots in the figure below