Please explain to me Lothar Meyer’s volume curve
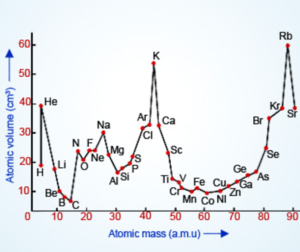
Lothar Meyer used atomic mass and atomic volume in x and y axis respectively and found the periodicity of elements.Elements of same group is found in the same position of the curve.
Lothar Meyer was the first scientist to notice the periodic trends in periodic properties. He observed that the element with the same physical and chemical properties occupy the same positions on the curve. This idea helps to arrange the elements with similar properties as the same group in the table.
Lothar Meyer’s volume curve is a graphical representation of the relationship between the atomic number of elements and their atomic volumes. It was first formulated in 1864 by chemist and physicist Lothar Meyer, who developed a graph to predict the approximate atomic volume for each element based on its atomic number. The volume curve generally shows that elements with higher atomic numbers have higher atomic volumes than those with lower atomic numbers. However, there are some anomalies where some elements have relatively smaller or larger atomic volumes than their neighboring elements on the periodic table.