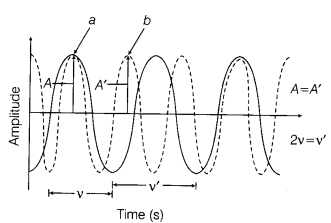
Represent graphically
- one diagram showing two sound waves having the same amplitude but different frequencies.
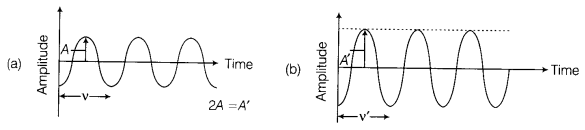
- two separate diagrams showing sound waves having the same frequency but different amplitudes.
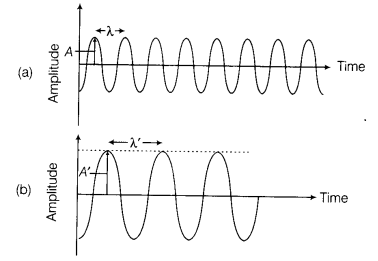
- two separate diagrams showing sound waves having different amplitudes and also different wavelengths.
- A diagram showing two sound waves having the same amplitude (A and A’) but different frequencies (v and v’).
- Two separate diagrams showing sound waves having the same frequency (v and v’) but different amplitudes (A and A’), i.e. A ≠ A’
- Two separate diagrams showing sound waves having different amplitudes (A and A’) and also different wavelengths (λ and λ’), i.e. A ≠ A’ and λ ≠ λ’.