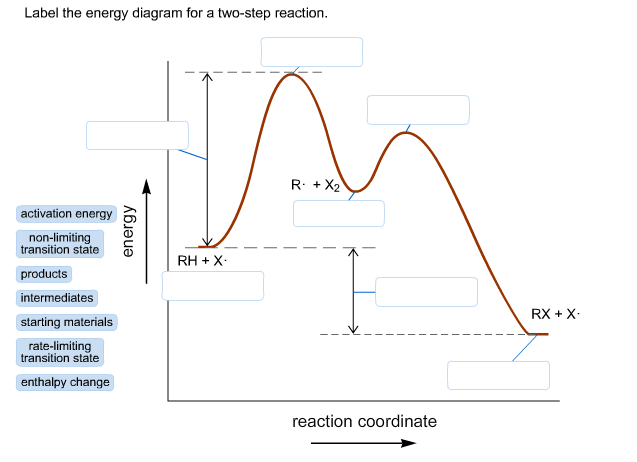
Label the energy diagram for a two-step reaction.
Concepts and reason
An energy profile diagram is a theoretical representation that shows how the energy of the system changes during a chemical reaction.
Some reactions undergo a series of steps, the overall reaction is added up to the steps. Two-step reactions proceed through two elementary steps.
Fundamentals
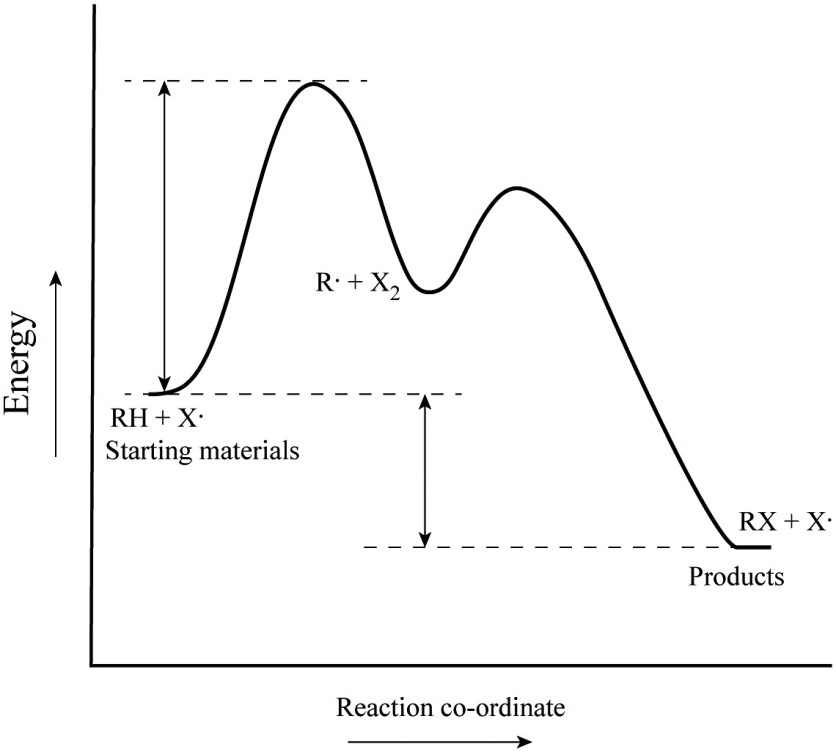
The starting material is the chemical substance, which is used for a chemical reaction as raw material. The product is also a chemical substance which is resultant of a chemical reaction.
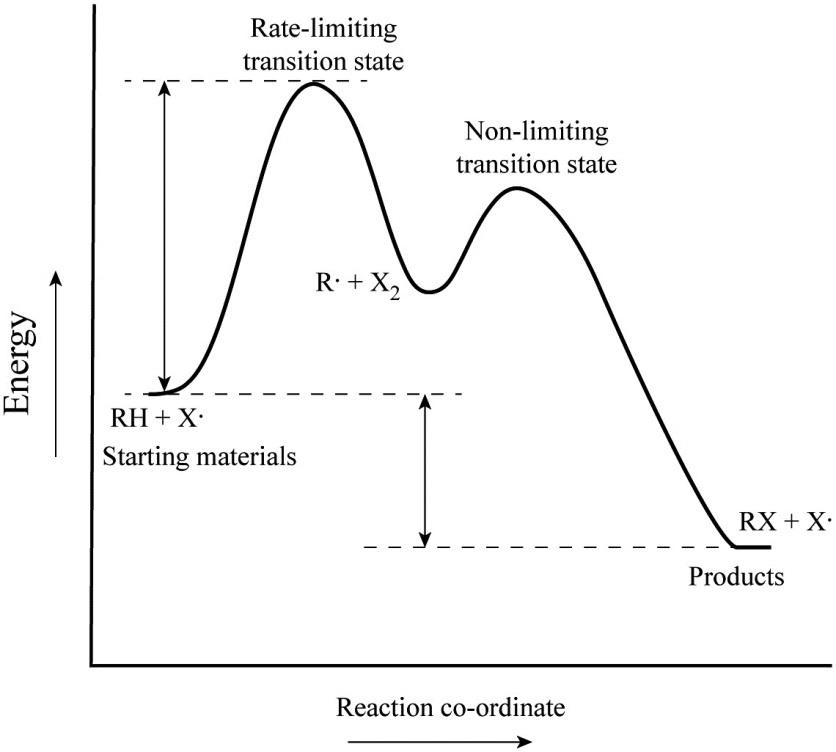
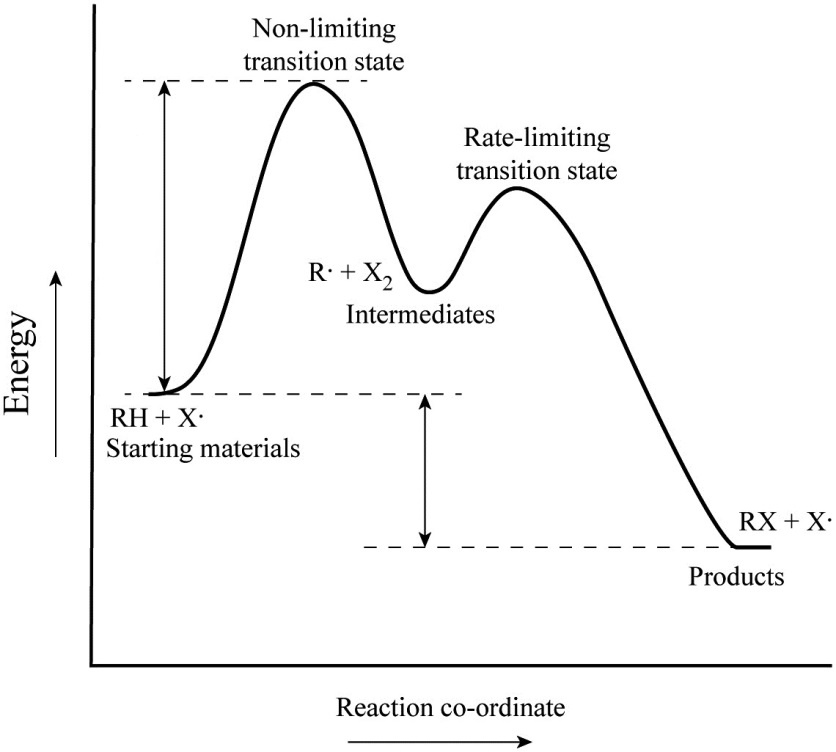
The transition state is the highest energy in the reaction coordinate.
The rate-limiting transition state is the step that requires the highest activation energy.
The transition state, which has less activation energy, is non-limiting transition state.
Activation energy is the energy required for reactant molecules to react and yield the product.
Enthalpy change is the energy different between the reactant and product.
The unstable substance is formed from the reactant, but it does not exist at the end of the reaction. This substance is called intermediate.
Answer:
Explanation:
In the energy diagram, starting material is shown in the left side and product in the right side of the curve.
Explanation:
A transition state is the intermediate state between the starting material and product, which has the highest energy in the energy profile diagram.
In a two-step transition, the step with the highest energy transition state is called the rate-determining step. The higher transition energy state is the rate-liming transition. The transition state which has less energy is the non-limiting transition state.
Explanation:
The trough between the reactant and product indicates the reaction intermediate. An intermediate has low energy as compared to transition state because it is more stable.