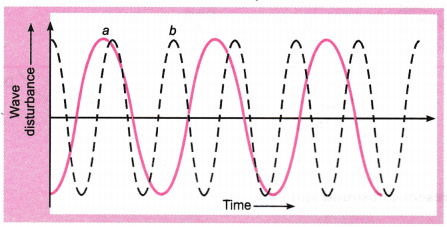
In the graphs given below representing the human voice, which of the two graphs is likely to be the male voice? Give reason for your answer
Answer:
Graph (a) represents the male voice. This is because the male voice has less pitch (or frequency) as compared to female.