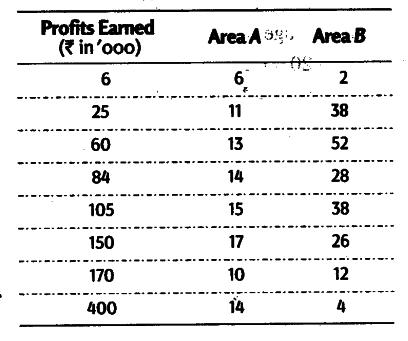
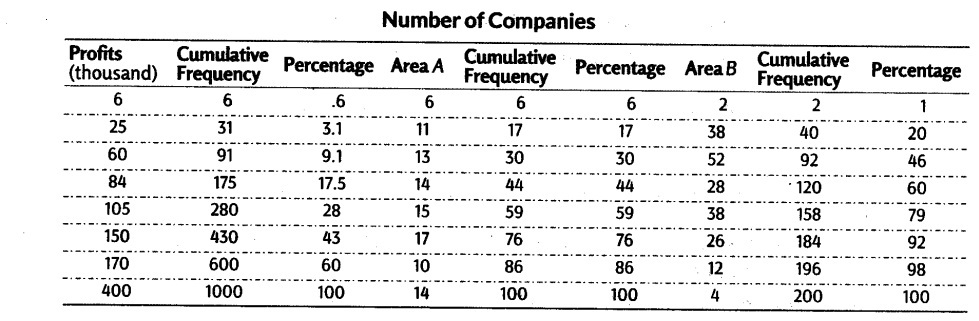
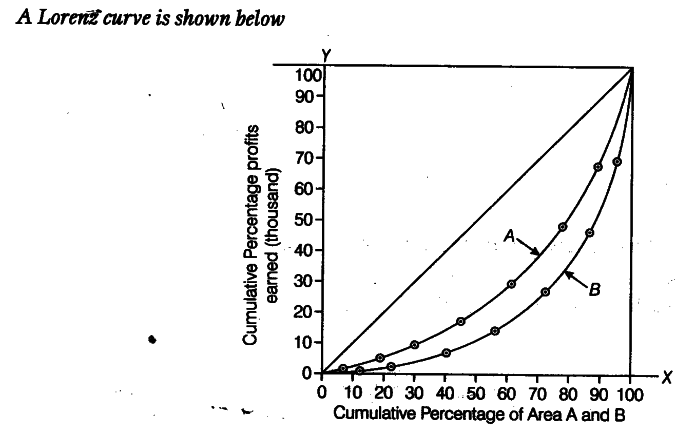
In the following table is given, the number of companies belonging to two areas A and B according to the amounts of profits earned by them. Draw their Lorenz curve.