1. Imagine you have collected data on the temperature and dissolved oxygen (mg/L) in a eutrophic lake over 5 years. You want to see if dissolved oxygen varies with temperature in this lake. What statistical test would you do? Explain why you chose this test.
2. Imagein the Biology department needs to decide which lab curriculum yeilds better student outcomes. Five sextions are assigned to curriculum A, and five sections are assigned to curriculum B. All sections are administered a pre- and post-test that measures students’ attitudes toward science and knowledge of biology. The department wants to see if students’ gains are greater in one curriculum or the other. What statistical test should be done to determine if there is a significant difference? Explain why you chose this test.
Answer:
Temperature and dissolved oxygen (mg,'L or milligram per liter) are two quantitative
variables in the current case, where they are measured over the same period oftime. They
would vary with time.
However, to find a relation between dissolved oxygen level and temperature, statistical test correlation and regression can be done. Correlation between two variables is indicated using the correlation coefficient®, its value lies between +1 and -1.
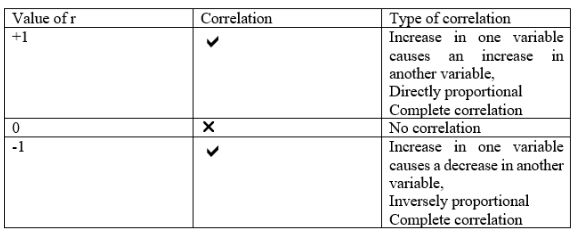
The value of r, if found to be non-zero, it can then be Ruther checked using the t-test, because there can be a correlation due to chance, to reject this possibility, the t-test is performed. This test is also called significance test.
This test can futher be extended to get a straight line on the graph for the two variables. This is called linear regression. The correlation coefficient ® tells how much one variable is changing when another is changing. The straight line after regression can be used to predict the value of dependent variable then using the value of the independent variable.