Identify what graphs of [X] versus time and [Y] versus time would look like for various orders.

Answer:
assuming x is a reactant and y is a product :-
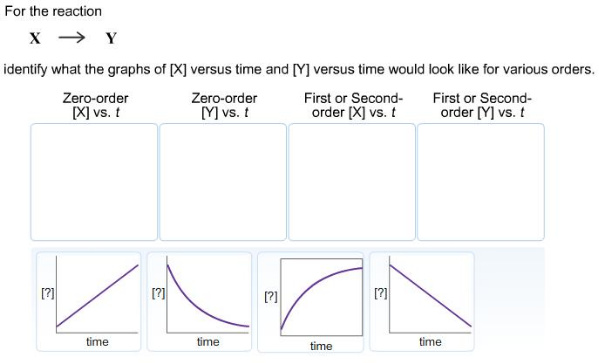
0-order [X] vs t is a straight line with a negative slope.
0-order [Y] vs t is a straight line with a positive slope.
1st order [X] vs. t is an exponentially decreasing line, toward a horizontal asymptote of zero or a constant concentration.
1st order [Y] vs. t is an exponentially increasing line, toward a horizontal asymptote of maximum concentration - where it will remain constant towards t=infinity.