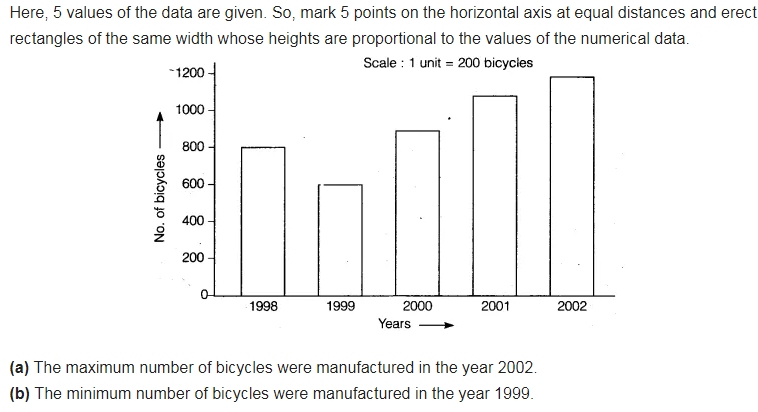
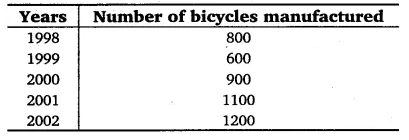
Following table shows the number of bicycles manufactured in a factory during the years 1998 to 2002. Illustrate this data using a bar graph. Choose a scale of your choice.
(a) In which year were the maximum number of bicycles manufactured?
(b) In which year were the minimum number of bicycles manufactured.