Figure shows versus graph far a particle moving along x-axis. In which region, farce on the particle is large.
Why ?
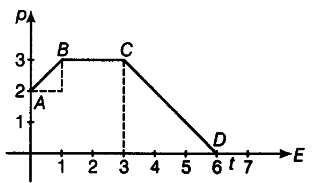
Net force is given by $F_{ net }$ = dp / dt
Also, rate of change of momentum = slope of graph.
As from graph,$slope_{ AB }$ = $slope_{CD}$
And slope (BC)= slope (DE)=0 W
So, force acting on the particle is equal in regions AB and CD and in regions BC and DE (which is zero).