Figure gives a speed-time graph of a particle in one-dimensional motion. Three different equal intervals of time are shown. In which interval is the average acceleration greatest in magnitude? In which interval is the average speed greatest? Choosing the positive direction as the constant direction of motion, give the signs of u and a in the three intervals. What are the accelerations at the points A, B, C and D?
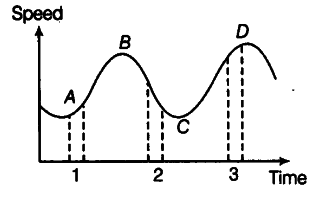
We know that average acceleration in a small interval of time is equal to slope of velocity-time graph in that interval. As the slope of velocity-time graph is maximum in interval 2 as compared to other intervals 1 and 3, hence the magnitude of average acceleration is greatest in interval 2. The average speed is greatest in interval 3 for obvious reasons.
In interval 1, the slope of velocity-time graph is positive, hence acceleration a is positive. The speed u is positive in this interval due to obvious reasons.
In interval 2, the slope of velocity-time graph is negative, hence acceleration a is negative. The speed u is positive in this interval due to obvious reasons.
In interval 3, the velocity-time graph is parallel to time axis, therefore acceleration a is zero in this interval but v is positive due to obvious reasons.
At points A, B, C and D, the velocity-time graph is parallel to time axis. Therefore, acceleration a is zero at all the four points.