Draw the graphs for the following tables of values, with suitable scales on the axes.
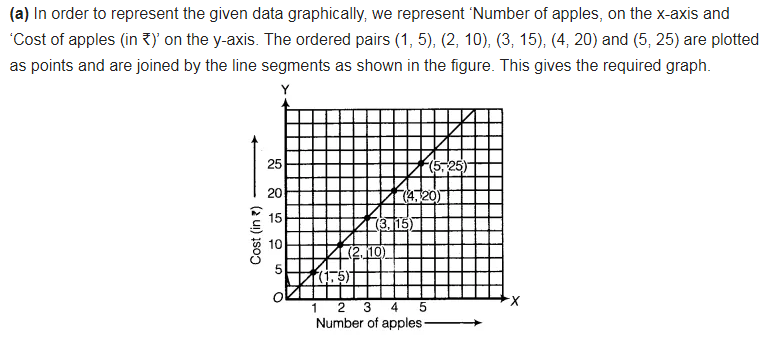
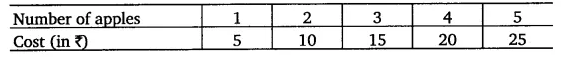
(a) Cost of apples
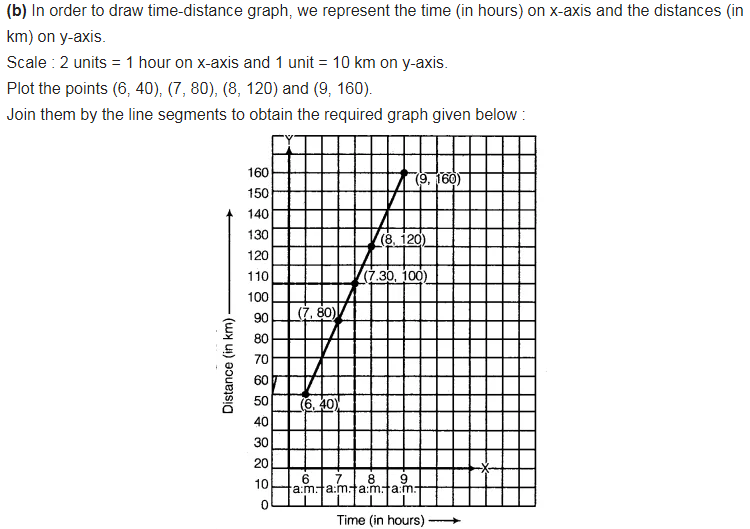
(b) Distance travelled by a car

(i) How much distance did the car cover during the period 7.30 a.m. to 8 a.m.?
(ii) What was the time when the car had covered a distance of 100 km since it’s start? Interest on deposits for a year
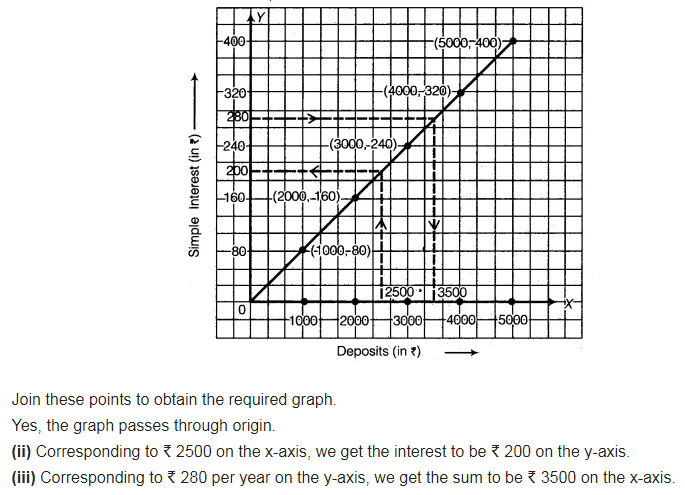
( c) Interest on deposits for a year.
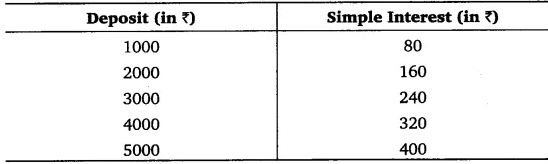
(i) Does the graph pass through the origin?
(ii) Use the graph to find the interest on ( 2500 for a year.
(iii) To get an interest of? 280 per year, how much money should be deposited?