Draw the graph of linear equations v = x and y = -x on the same cartesian plane. What do you observe?
Here, first equation is y = x.
When x = 0, then y = 0
When x = 1, then y = 1
When x = 2, then y = 2
Table for y = x is

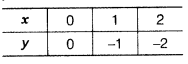
and second equation is y = - x.
When x = 0, then y = 0
When x = 1, then y = -1
When x = 2, then y = -2
Table for y = - x is
Now, the graph for both the equations are shown below
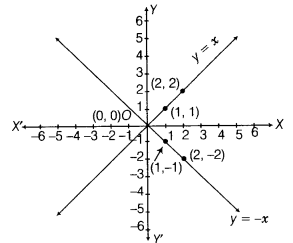
Clearly, both the lines intersect each other at origin.