Draw a scatter diagram of the following data and interpret to find the nature of correlation

The pair of points are (2,6), (3, 5), (5,7), (6,8), (8,12) and (9,11).
Now, we plot the points on a graph paper, which is shown below
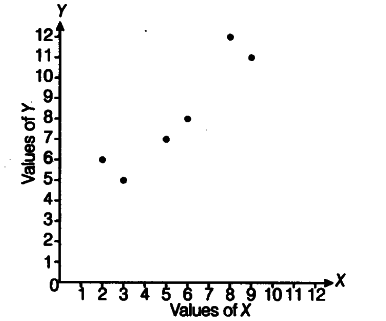
Interpretation :The diagram indicates that there is high degree of positive correlation because the plotted points are near to each other and the trend of the points is upward.