Draw a scatter diagram and interpret whether correlation is positive or negative.

The pair of points are (4, 78), (5, 72), (6, 66), (7, 60), (8, 54), (9, 48), (10, 42), (11, 36), (12,30), (13,24), (14,18) and (15,12). Now we plot the points on a 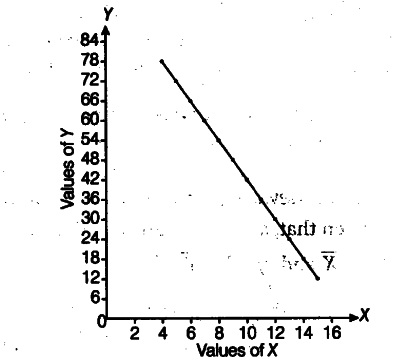 graph paper, which is shown below
Interpretation The diagram indicates that there is perfect negative correlation between the values of the two variables Z and Y.