Draw a scatter diagram and indicate the nature of correlations

The pair of points are (10, 5), (20, 10), (30, 15), (40, 20), (50, 25), (60, 30), (70, 35) and (80,40). Now, we plot the points on a graph paper which is shown below
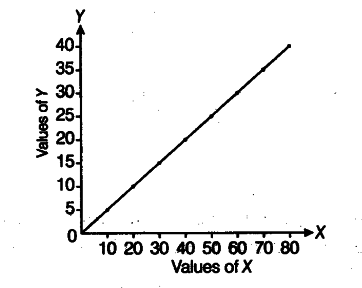
Interpretation The diagram indicates that there is perfect positive correlation between the values of the two variables Zand Y.