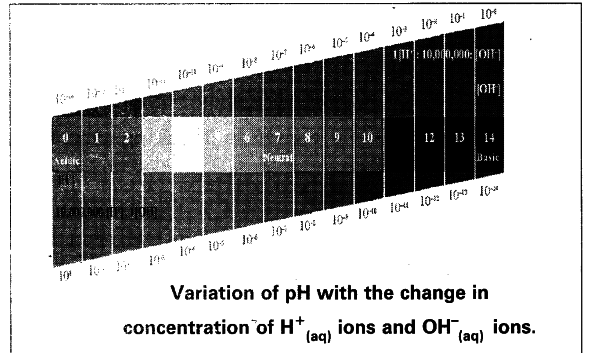
Draw a neat diagram showing variation of pH with the change in concentration of ${{H}^{+}}$ ions and ${{OH}^{-}}$