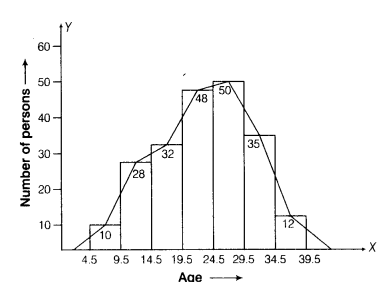
Draw a histogram to represent the following grouped frequency.
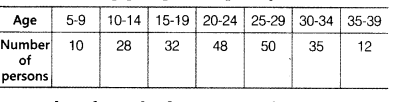
Also, draw the frequency polygon.
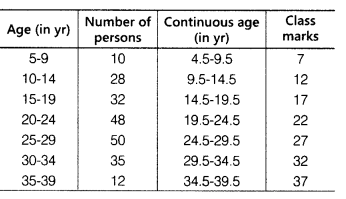
Given data is in distcontin’uous class interval form, so firstly make the given data in continuous class interval form.
Draw two perpendicular axes and take age on X-axis and number of person on Y-axis. Draw the histogram.
Now, join the mid-points of each bar and we get continuous frequency polygon.