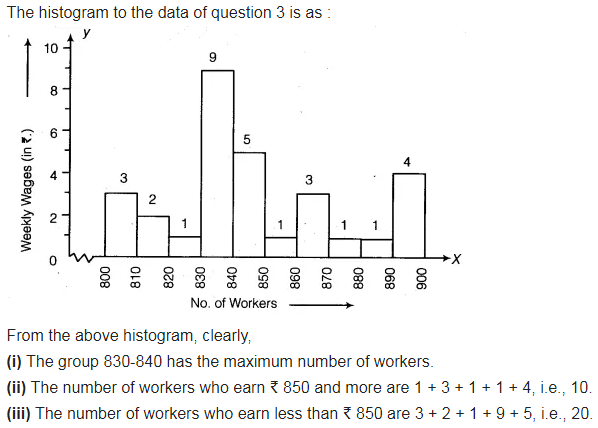
Draw a histogram for the frequency table made for the data in question 3, and answer the following questions.
(i) Which group has the maximum number of workers?
(ii) How many workers earn? 850 and more?
(iii) How many workers earn less than? 850?