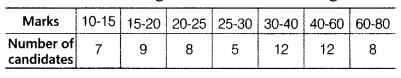
Draw a histogram for the following data.
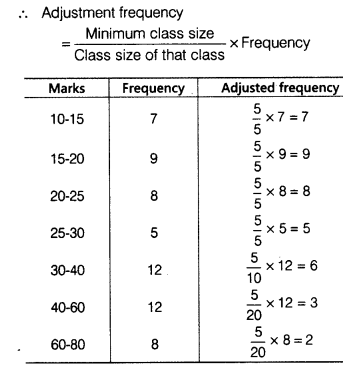
Here, the classes are of unequal widths, so let us form the table with adjusted frequencies.
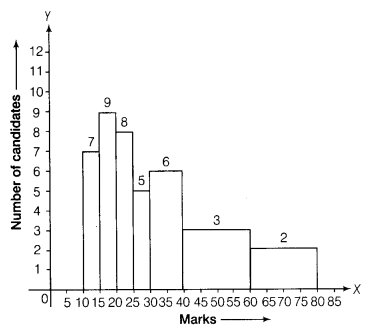
We take marks along the X-axis with suitable scale i.e. 1 cm = 5 units and number of candidates along the Y-axis with suitable scale i.e. 1 cm = 1 unit
On the basis of above adjusted frequency and class marks, we can draw the following histogram