Draw a graph for the following
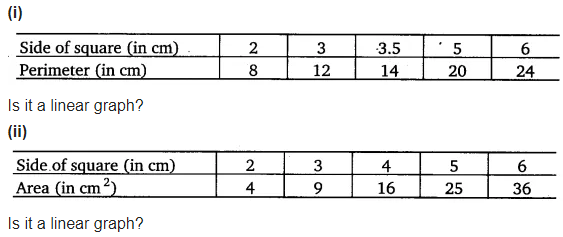
(i) In order to represent the given data graphically, we represent the side of square (in cm) on the x-axis and the perimeter (in cm) on the y-axis. Scale : 1 units = 1 cm on x-axis and y-axis.
Plot the points (2, 8), (3, 12), (3.5, 14), (5, 20) and (6, 24). Join these points to obtain the required graph.
It is a linear graph.
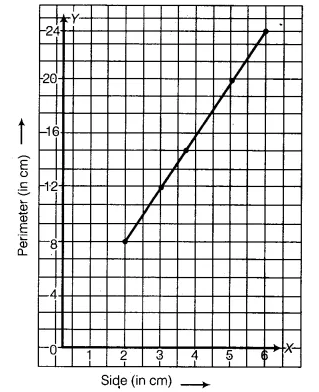
(ii) In order to represent the given data graphically, we represent the side of square (in cm) on the x-axis and the area (in cm2) on the y-axis. Scale : 1 unit = 1 cm on x-axis and 1 unit = 1 cm2 on y-axis.
Plot the points (2, 4), (3, 9), (4, 16), (5, 25) and (6, 36). Join these points to obtain the required graph.
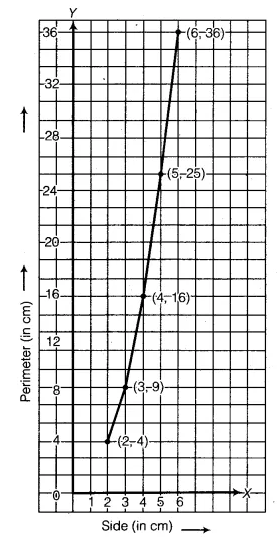
It is not linear.