Can there be a time-temperature graph as follows? Justify your answer.
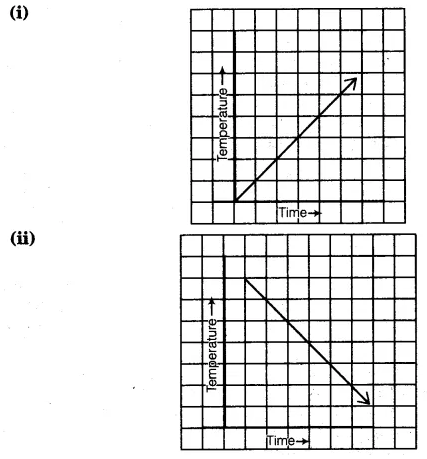
(i) This represents a time-temperature graph because it represents a smooth rise in temperature and is represented by a line graph.
(ii) This represents a time-temperature graph because it represent a smooth fall in temperature and is represented by a line graph.
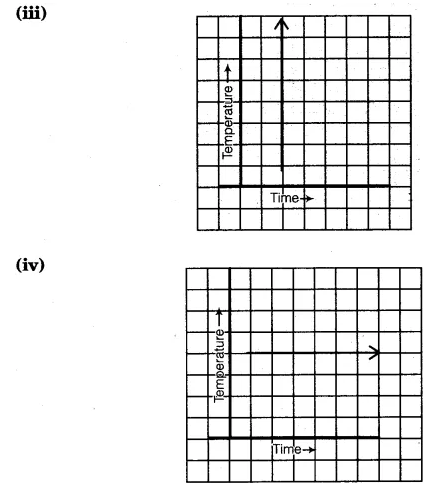
(iii) This does not represent a time-temperature because it shows different temperatures at the same time.
(iv) This represents a time-temperature graph because it shows a constant temperature at different times and is a line graph.