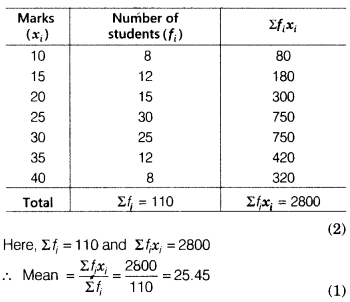
Calculate the mean and mode for the following data.
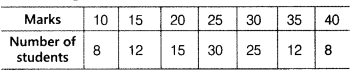
The table for marks and number of students is given below
We know that mode is the value, which contain highest frequency.
Here, we see in the given table that 30 is the highest frequency and its corresponding marks is 25.
Hence, mode of the given data is 25.