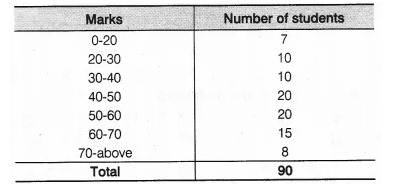
A teacher wanted to analyse the performance of two sections of students in a mathematics test of 100 marks. Looking at their performances, she found that a few students got under 20 marks and a few got 70 marks or above. So she decided to group them into intervals of varying sizes as follows
0-20, 20 – 30, …, 60 – 70, 70 – 100. Then she formed the following table
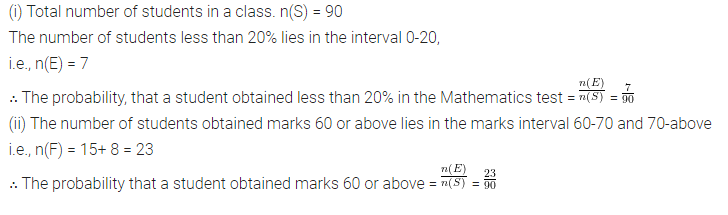
(i) Find the probability that a student obtained less than 20% in the mathematics test.
(ii) Find the probability that a student obtained marks 60 or above.