A courier-person cycles from a town to a neighbouring suburban area to deliver a parcel to a merchant. His distance from the town at different times is shown by the following graph :
(a) What is the scale taken for the time axis?
(b) How much time did the person take for the travel?
( c) How far is the place of the merchant from the town?
(d) Did the person stop on his way? Explain.
(e) During which period did he ride fastest?
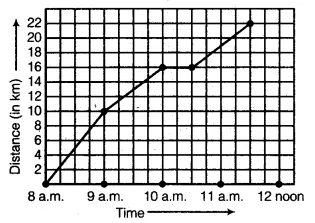
In the graph, we find that the time (in hours) is represented on the x-axis and the distance (in km) is represented on the y-axis. The distance at any time can be read from the graph exactly in the same way as we read the coordinates of a point. From the graph, we observe that :
(a) The scale taken for the time axis is : 4 units = 1 hour.
(b) The person took 3
( c) The merchant’s place from the town is 22 km.
(d) Yes; this is indicated by the horizontal part of the graph (10 a.m. -10.30 a.m.)
(e) Between 8 a.m. and 9 a.m. he ride faster.