14 Draw a ‘less than’ ogive and ‘more than’ ogive curves for the following frequency distribution.
| Marks | 0-10 | 10-20 | 20-30 | 30-40 | 40-50 | 50-60 |
|---|---|---|---|---|---|---|
| No. of students | 3 | 4 | 8 | 10 | 3 | 2 |
14 Draw a ‘less than’ ogive and ‘more than’ ogive curves for the following frequency distribution.
| Marks | 0-10 | 10-20 | 20-30 | 30-40 | 40-50 | 50-60 |
|---|---|---|---|---|---|---|
| No. of students | 3 | 4 | 8 | 10 | 3 | 2 |
i. Less than ogive curves: In this method, frequencies are cumulated and presented in a graph corresponding to upper limits of the classes in a frequency distribution. Firstly, all the data are converted into less than cumulative frequency distribution as follows-
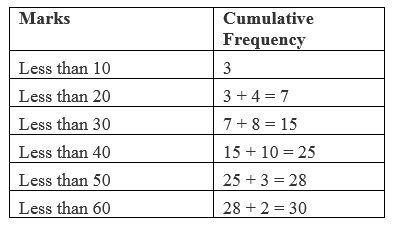
This curve is drawn by plotting cumulative frequencies against the upper limit of the class intervals. And these points are joined to obtain the less than ogive curve.
ii. More than ogive curves: In this method, frequencies are cumulated and presented in a graph corresponding to lower limits of the classes in a frequency distribution. Firstly, all the data are converted into more than cumulative frequency distribution as follows-
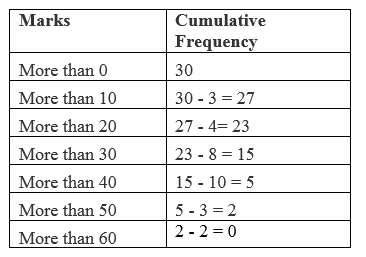
This curve is drawn by plotting cumulative frequencies against the lower limit of the class intervals. And these points are joined to obtain more than ogive curve.