Pie-Diagram represents the total magnitude and its various components and in simple term we can say, it is a circle that may be divided into various sectors representing the respective components. The circle comprises 360°.
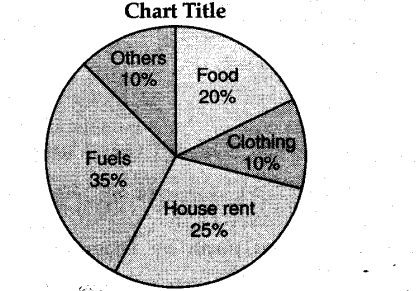
For example, Pie diagram showing amount spent on expenditure: