The lines A to D below show how change in temperature can affect the rate of enzyme reaction. Line N shows the rate of reaction under optimum temperature.
Which line A, B,CorD shows the rate of enzyme reaction at 60°C ?
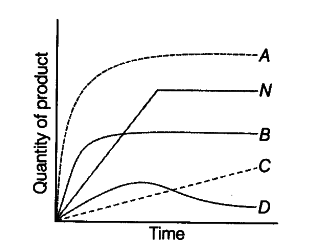
The lines A to D below show how change in temperature can affect the rate of enzyme reaction. Line N shows the rate of reaction under optimum temperature.
Which line A, B,CorD shows the rate of enzyme reaction at 60°C ?
Line B, will show the rate of reaction at 60 °C because the rate of reaction initially is more rapid, but then decreases as the enzyme becomes denatured by the high temperature. Thus, the quantity of product remains constant at a lower amount compared to line N.